BPS Presidential Youth Fitness Data
Note: Assessment period #5 was May 2015
Update: 8/1/2016
Healthy Fitness Zone Overall Achievement
Percentage of students in the Healthy Fitness Zone for at least 5 areas


Body Mass Index (BMI) Results
Percentage of students who are Underweight, Healthy Weight, or Overweight (overweight and obese combined), based on their Body Mass Index (BMI)


Percentage of students with non-Healthy BMI (underweight, overweight, and obese, combined)


Students with healthy weight vs. students overweight

Results for Individual Presidential Fitness Tests
Aerobic Capacity (based on PACER assessment)


Flexibility (based on Sit and Reach assessment)


Arm, Shoulder, Chest strength (based on Push-Ups assessment)


Core / Abdominal strength (based on Curl-Ups assessment)


Back strength (based on Trunk Lift assessment)

Disregard assessment #5 results: insufficient data points
Prior BPS Presidential Youth Fitness Data
Updated 11/2/2015, 12:00 p.m.
All findings based on submitted scores as of the most recent update.
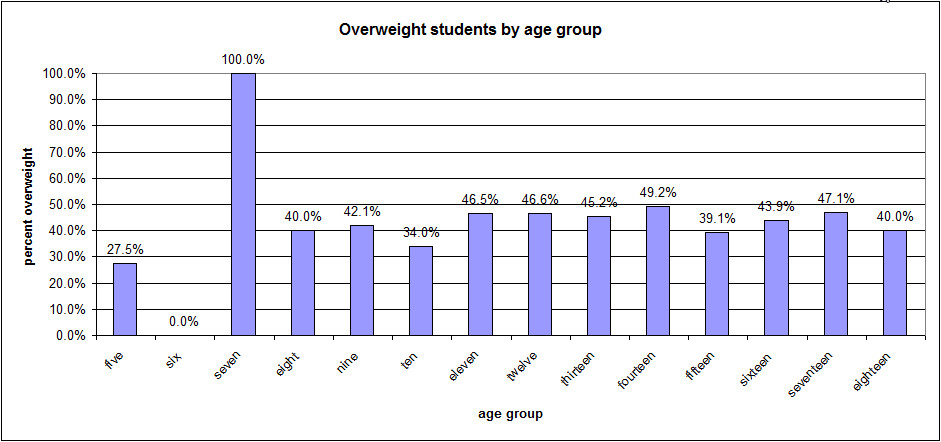
CAUTION: All findings for students aged 6 and 7 years old are completely unreliable, as those age groups have only 1 representative each. Similarly, findings for students aged 18 and 19 are unreliable due to the low number of data points. You may safely ignore any age-specific findings for those age groups.
Data Submission Findings
Age distribution for submitted data
Student data submitted by school
Presidential Youth Fitness Findings
Body Mass Index (BMI) was calculated for all students and compared to national guidelines for 4 categories. Placement in the 4 categories varies by student sex and age. BMI was calculated using the following formula: (weight x 703) / (height in inches)2
Similarly, placement in the Healthy Fitness Zone for each assessment depends on a student’s age and sex. Overall, requirements for the Healthy Fitness Zone get more challenging as a student gets older.
Percentage of all students in weight categories based on BMI
Students in the “healthy” weight category based on BMI by school
Percentage of students in the “healthy” category compared to students in “overweight” and “obese” categories combined*
*Does not include the 5% of students in the “underweight” category
Overweight (overweight and obese) students based on BMI by school
Percentage of overweight (overweight and obese) students based on BMI by age
Students in Healthy Fitness Zone for aerobic capacity (based on PACER) by age
Students in Healthy Fitness Zone for Curl Ups by age
Students in Healthy Fitness Zone for trunk Lift by age
Students in Healthy Fitness Zone for push ups by age
Students in Healthy Fitness Zone for sit and reach (right and left) by age
Federal Reporting
These findings are established based on the prior fitness components and are reported to the federal program office annually, or more frequently. Continued project funding will depend upon improvements in these findings.
Students in Healthy Fitness Zone for at least 5 of 6 fitness components by school
Students in Healthy Fitness Zone for at least 5 of 6 fitness components by age


